Team:FHS Frederick MD/Electrophoresis
From 2014hs.igem.org
Electrophoresis
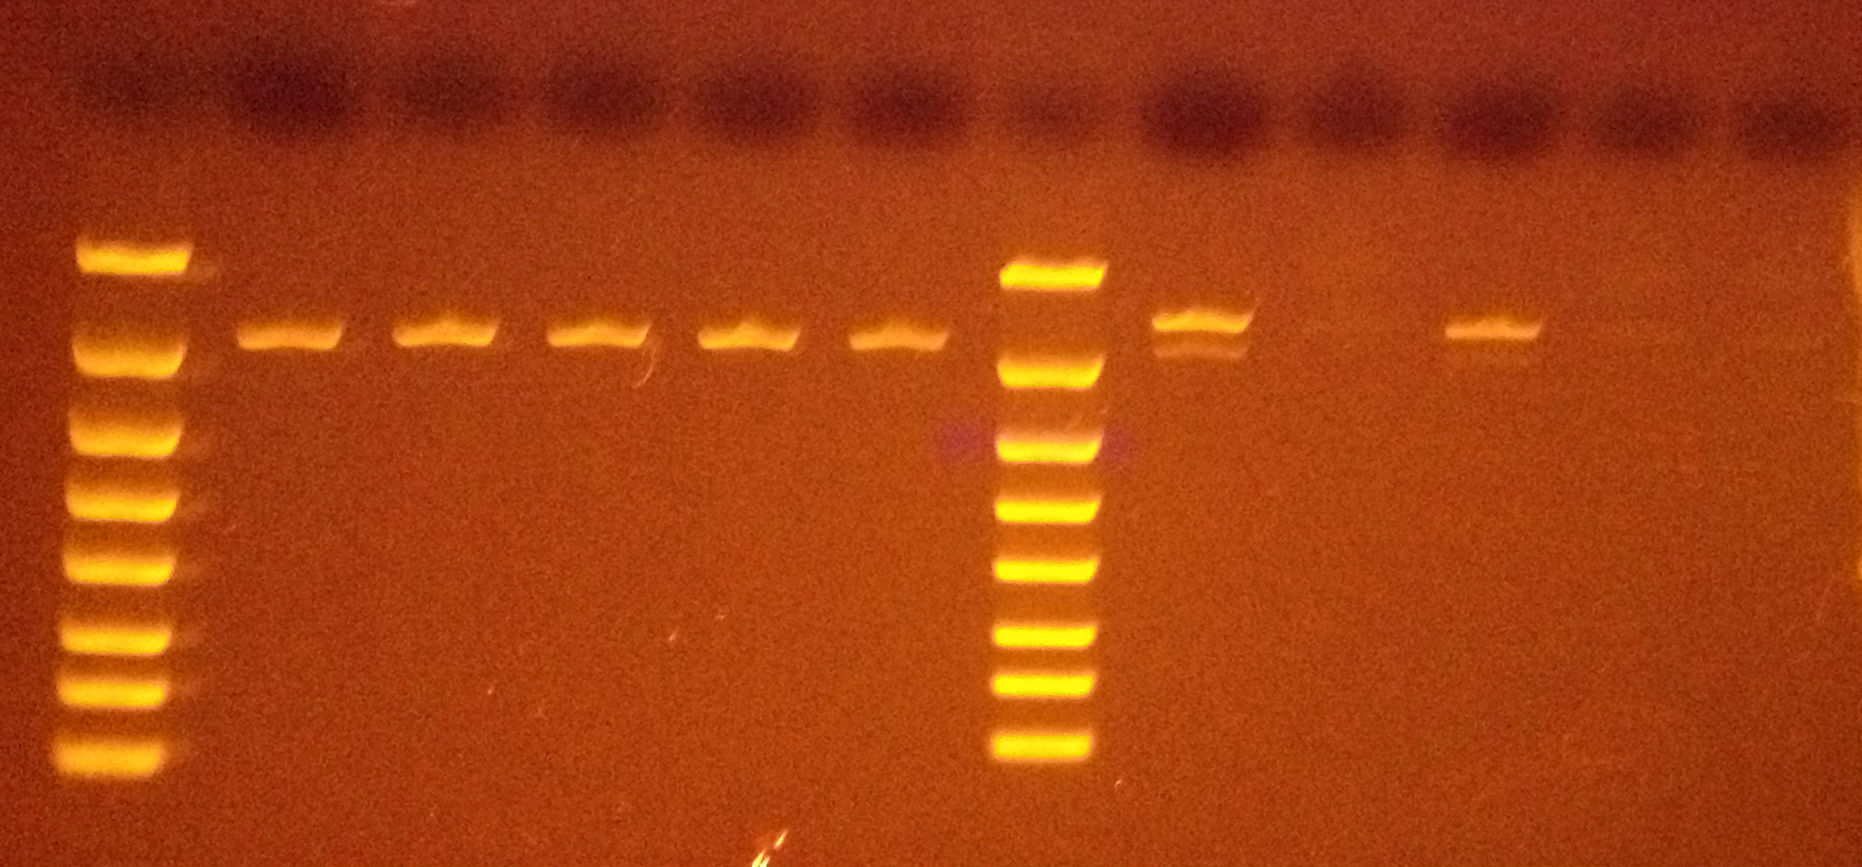
As seen in the gel, the first five bands, after the DNA marker well, show that the pSB1C3/NirB plasmid was transformed and showed an appropriate size banding pattern. The next five wells represented the pSB1C3/LOV plasmid. As seen in the gel, only two samples show bands. Further experiments will need to be completed to study why transformation do not occur fully.
We sequenced those samples which showed strong bands on the gel.
 "
"


