 "
"
Team:CIDEB-UANL Mexico/math capture
From 2014hs.igem.org
Oda.ibarra (Talk | contribs) |
Lisandro12 (Talk | contribs) |
||
| (124 intermediate revisions not shown) | |||
| Line 324: | Line 324: | ||
</style> | </style> | ||
<body> | <body> | ||
| + | <!-- MathJax (LaTeX for the web) --> | ||
| + | <script type="text/x-mathjax-config"> | ||
| + | MathJax.Hub.Config({tex2jax: {inlineMath: [['$','$'], ['\\(','\\)']]}}); | ||
| + | MathJax.Hub.Config({ | ||
| + | TeX: { | ||
| + | equationNumbers: { autoNumber: "AMS" } | ||
| + | } | ||
| + | }); | ||
| + | </script> | ||
| + | <script type="text/javascript" src="http://cdn.mathjax.org/mathjax/latest/MathJax.js?config=TeX-AMS-MML_HTMLorMML"></script> | ||
<div class="wrapper"> | <div class="wrapper"> | ||
<div id="welcome" class="container"> | <div id="welcome" class="container"> | ||
| Line 332: | Line 342: | ||
<div class="container-text"> | <div class="container-text"> | ||
| - | <p>The capture module is based in the use of NhaS | + | <p>The capture module is based in the use of NhaS, but NhaS was not the only gene expressed in the circuit (also RFP was used as a reporter). It was needed to consider this factor. The circuit is shown below:</p> |
| - | <center><p><img width=334 height= | + | <br><center><p><img width=334 height=100 src="https://static.igem.org/mediawiki/2014hs/6/60/Nhas_circuit_math.png" |
align=center hspace=12 alt="IMG_0317"></p></center> | align=center hspace=12 alt="IMG_0317"></p></center> | ||
| - | <p>As it is shown in the circuit, the transcription rate is affected by Uv light | + | <br> |
| + | <p>As it is shown in the circuit, the transcription rate is affected by Uv light. Uv promoters, according to Shuang Li’s team (2006), have less efficiency than constitutive promoters, which is approximately 60% of constitutive promoters.</p> | ||
| + | <br> | ||
| - | + | \begin{equation} | |
| + | \large \frac{d\left [ mRNA \right ]}{dt}=\alpha_{1}\cdot f_{y}-d1\left [ mRNA \right ] | ||
| + | \end{equation}<br> | ||
| - | + | \begin{equation} | |
| + | \large f_{y}=0.6 | ||
| + | \end{equation} | ||
| - | <p> | + | <br> |
| + | <p>It was assumed that <b><i>“f<sub>y</sub>”</i></b>, is the regulatory function that can activate or inhibit the system of a given gene; it was assumed 0.6 of the percentage given by Shuang Li’s team. Uv rays activate the promoter, but it is not as efficient as constitutive promoters in the transcription process.</p> | ||
| - | <p> | + | <br> |
| + | <p>The parameters for translation and transcription rates from <a href="https://2008.igem.org/Team:NTU-Singapore">Singapore 2008</a> team were used, as well as the transcription and translation speeds carried out by <i>E. coli</i>, assuming a transcription speed of <i>70nt/s</i> and a translation speed of <i>40aa/s</i>. They were used in the equations below with the NhaS and RFP gene <i>(1019nt)</i>, NhaS with <i>69aa</i>.It was not needed to model RFP because is not the purpose of the team, so this section is only focused in NhaS.</p> | ||
| - | < | + | <br> |
| + | \begin{equation} | ||
| + | \large \alpha_{1} =\frac{transcription speed}{gene length (nt)} | ||
| + | \end{equation}<br> | ||
| - | < | + | \begin{equation} |
| + | \large \alpha_{2} =\frac{trasnlation speed}{protein length (aa)} | ||
| + | \end{equation}<br> | ||
| - | + | \begin{equation} | |
| + | \large \alpha_{1}=\frac{(70)(60)}{1019}=4.12 | ||
| + | \end{equation}<br> | ||
| - | <center><p><img width= | + | \begin{equation} |
| + | \large \alpha_{2}(NhaS)=\frac{(40)(60)}{69}=34.78 | ||
| + | \end{equation}<br> | ||
| + | |||
| + | <br> | ||
| + | <p>After, it was needed to use the parameters for degradation rates of proteins and mRNAs obtained from <a href="https://2009.igem.org/Team:PKU_Beijing">PKU Beijing 2009</a> team:</p> | ||
| + | |||
| + | <br> | ||
| + | \begin{equation} | ||
| + | \large D_{i}= \frac{1}{half-life(min)} + \frac{1}{30min} | ||
| + | \end{equation}<br> | ||
| + | |||
| + | \begin{equation} | ||
| + | \large D_{p} = \frac{1}{half-life(min)} + \frac{1}{30min} | ||
| + | \end{equation} | ||
| + | |||
| + | <br> | ||
| + | <p>However, since NhaS half-life has not been determined yet, it was decided to search for homologous proteins with the same function as NhaS. The team found that the half-life of membrane proteins produced in <i>E. coli</i> range between 2 to 20 hours (Hare, 1991) and as NhaS is a membrane protein, its half life should be between those values. At the end was decided to use 2 hours as NhaS half-life because of its relatively small size (<i>69aa</i>). | ||
| + | |||
| + | <p>Later, it was used the information from Selinger’s team (2003) to determine the mRNA degradation. They performed several experiments for finding the average mRNA half-life in <i>E. coli</i>. They used mRNAs about <i>1100nt</i> concluding that they have an average half-life of 5min. Using the previous relation was found mRNA's half-life from NhaS and RFP gene was about 4.63min.</p> | ||
| + | <br> | ||
| + | |||
| + | \begin{equation} | ||
| + | \large HL=\frac{1100(nt)}{5min} | ||
| + | \end{equation} | ||
| + | |||
| + | <br> | ||
| + | <p>With the previous information the degradation rates for both transcription and translation of NhaS were found. | ||
| + | <br> | ||
| + | |||
| + | \begin{equation} | ||
| + | \large d_{1}= \frac{1}{4.63} + \frac{1}{30}=0.25 | ||
| + | \end{equation}<br> | ||
| + | |||
| + | \begin{equation} | ||
| + | \large d_{2}(NhaS)= \frac{1}{120} + \frac{1}{30}=0.041 | ||
| + | \end{equation}<br> | ||
| + | |||
| + | <br> | ||
| + | <p>For the simulation, the team used Simbiology® by plugging in the previously calculated data from the equations to find the amount of proteins <i>E. coli</i> would produce at certain time. The next graph shows the results of the simulation (assuming <i>E. coli</i> is under UV rays which actives its promoter):</p> | ||
| + | <br> | ||
| + | |||
| + | <center><p><img width=400 height=300 src="https://static.igem.org/mediawiki/2014hs/9/9d/NhaS_only.png" | ||
align=center hspace=12 alt="IMG_0317"></p></center> | align=center hspace=12 alt="IMG_0317"></p></center> | ||
| - | <p> | + | <br> |
| + | <p>But for translation, there was another factor taken in consideration, the <b><i>“f<sub>post</sub>”</i></b> which were the post-translational variables affecting the production of the functional protein:</p> | ||
| + | <br> | ||
| - | + | \begin{equation} | |
| + | \large \frac{d[P]}{dt} = \alpha_{2} \cdot[mRNA] - d_{2}[P] - f_{post} | ||
| + | \end{equation} | ||
| - | <p> | + | <br> |
| + | <p>Since NhaS protein needs to be expressed in <i>E. coli's</i> membrane, it was needed to find the average velocity at which <i>E. coli</i> exports its proteins. The process by which bacteria exports its proteins is divided into three phases, the “breathing” (which happens between translation and the second phase), the second phase (which is the protein movement to the membrane) and finally, the translocation (in this phase the protein attaches to the membrane of bacteria) (Peskin, 1991). With the previous data it was determined <i>E. coli</i> completes these phases in an average time of 5 to 6 min, depending on the protein size (Driessen, 1990). 5min were plugged into the data because NhaS protein is relatively small (69aa). | ||
| - | <center><p><img width= | + | <p>With the rate of protein transport, Simbiology® was used to model the functional NhaS production. The results are shown in the next diagrams (assuming <i>E. coli</i> is under UV rays which actives its promoter):</p><br> |
| + | |||
| + | <center><p><img width=400 height=300 src="https://static.igem.org/mediawiki/2014hs/e/e1/Nhas_diagram.png" | ||
align=center hspace=12 alt="IMG_0317"></p></center> | align=center hspace=12 alt="IMG_0317"></p></center> | ||
| - | <center><p><img width= | + | <center><p><img width=500 height=350 src="https://static.igem.org/mediawiki/2014hs/f/fb/Nhas_not_alone.png" |
align=center hspace=12 alt="IMG_0317"></p></center> | align=center hspace=12 alt="IMG_0317"></p></center> | ||
| - | <p>When | + | <br> |
| + | <p>When both graphs were compared (Graph 1 and Graph 2) it was concluded that the amount of functional NhaS is really big. It was assumed that this happened because NhaS is only <i>69aa</i> in length. Also, it was concluded that NhaS is functional when it is located in the membrane (by functional is meant that it has the potential to capture Na<SUP>+</SUP> ions and be able to give resistance to saline environments) of <i>E. coli</i>. As is shown in Graph 2 the amount is of proteins ready to bind Na<SUP>+</SUP> produced are about 6500. | ||
| + | |||
| + | <br><p><b> | ||
| + | <h2>Bibliography/References</h2> | ||
| + | </b></p> | ||
| + | |||
| + | <font size="2"> | ||
| + | <p>● DRIESSEN, Arnold W. W. (1990). Proton transfer rate-limiting for translocation of precursor proteins by the Escherichia coli translocase. <i>Biochemistry</i>, 2471-2475.</p> | ||
| + | <p>● HARE, James K. T. (1991). Mechanisms of plasma membrane protein degradation: Recycling proteins are degraded more rapidly than those confined to the cell surface. <i>PNAS</i>, 5902-5906.</p> | ||
| + | <p>● LI, Shuang L. X. (2007). A set of UV-inducible autolytic vectors for high throughput screening. <i>Journal of biotechnology</i>, 647-652.</p> | ||
| + | <p>● LONNGO, Diane J. H. (2006). Dynamics of single-cell gene expression. <i>Molecular Systems Biology</i>, 1-10.</p> | ||
| + | <p>● PESKIN, Charles S. S. (1991). What drives the translocation of proteins. <i>Biophysics</i>, 3770-3774.</p> | ||
| + | <p>● SELINGER, Douglas R. M. (2003). Global RNA Half-Life Analysis in Escherichia coli Reveals Positional Patterns of Transcript Degradation. <i>Genome Research</i>, 216-223. </p> | ||
Latest revision as of 01:52, 21 June 2014
|
|


Capture Module
The capture module is based in the use of NhaS, but NhaS was not the only gene expressed in the circuit (also RFP was used as a reporter). It was needed to consider this factor. The circuit is shown below:
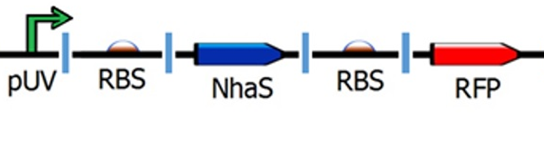
As it is shown in the circuit, the transcription rate is affected by Uv light. Uv promoters, according to Shuang Li’s team (2006), have less efficiency than constitutive promoters, which is approximately 60% of constitutive promoters.
\begin{equation} \large \frac{d\left [ mRNA \right ]}{dt}=\alpha_{1}\cdot f_{y}-d1\left [ mRNA \right ] \end{equation}
\begin{equation} \large f_{y}=0.6 \end{equation}
It was assumed that “fy”, is the regulatory function that can activate or inhibit the system of a given gene; it was assumed 0.6 of the percentage given by Shuang Li’s team. Uv rays activate the promoter, but it is not as efficient as constitutive promoters in the transcription process.
The parameters for translation and transcription rates from Singapore 2008 team were used, as well as the transcription and translation speeds carried out by E. coli, assuming a transcription speed of 70nt/s and a translation speed of 40aa/s. They were used in the equations below with the NhaS and RFP gene (1019nt), NhaS with 69aa.It was not needed to model RFP because is not the purpose of the team, so this section is only focused in NhaS.
\begin{equation} \large \alpha_{1} =\frac{transcription speed}{gene length (nt)} \end{equation}
\begin{equation} \large \alpha_{2} =\frac{trasnlation speed}{protein length (aa)} \end{equation}
\begin{equation} \large \alpha_{1}=\frac{(70)(60)}{1019}=4.12 \end{equation}
\begin{equation} \large \alpha_{2}(NhaS)=\frac{(40)(60)}{69}=34.78 \end{equation}
After, it was needed to use the parameters for degradation rates of proteins and mRNAs obtained from PKU Beijing 2009 team:
\begin{equation} \large D_{i}= \frac{1}{half-life(min)} + \frac{1}{30min} \end{equation}
\begin{equation} \large D_{p} = \frac{1}{half-life(min)} + \frac{1}{30min} \end{equation}
However, since NhaS half-life has not been determined yet, it was decided to search for homologous proteins with the same function as NhaS. The team found that the half-life of membrane proteins produced in E. coli range between 2 to 20 hours (Hare, 1991) and as NhaS is a membrane protein, its half life should be between those values. At the end was decided to use 2 hours as NhaS half-life because of its relatively small size (69aa).
Later, it was used the information from Selinger’s team (2003) to determine the mRNA degradation. They performed several experiments for finding the average mRNA half-life in E. coli. They used mRNAs about 1100nt concluding that they have an average half-life of 5min. Using the previous relation was found mRNA's half-life from NhaS and RFP gene was about 4.63min.
\begin{equation} \large HL=\frac{1100(nt)}{5min} \end{equation}
With the previous information the degradation rates for both transcription and translation of NhaS were found.
\begin{equation}
\large d_{1}= \frac{1}{4.63} + \frac{1}{30}=0.25
\end{equation}
\begin{equation}
\large d_{2}(NhaS)= \frac{1}{120} + \frac{1}{30}=0.041
\end{equation}
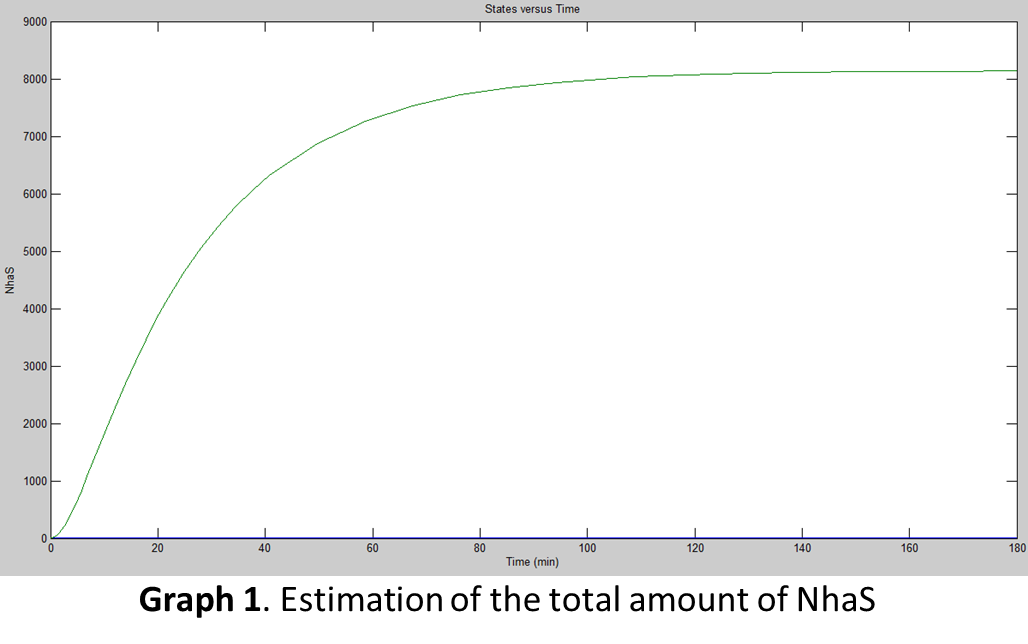
For the simulation, the team used Simbiology® by plugging in the previously calculated data from the equations to find the amount of proteins E. coli would produce at certain time. The next graph shows the results of the simulation (assuming E. coli is under UV rays which actives its promoter):
But for translation, there was another factor taken in consideration, the “fpost” which were the post-translational variables affecting the production of the functional protein:
\begin{equation} \large \frac{d[P]}{dt} = \alpha_{2} \cdot[mRNA] - d_{2}[P] - f_{post} \end{equation}
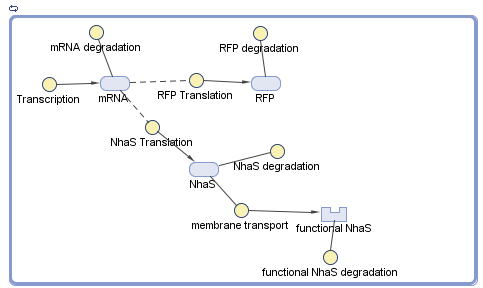
Since NhaS protein needs to be expressed in E. coli's membrane, it was needed to find the average velocity at which E. coli exports its proteins. The process by which bacteria exports its proteins is divided into three phases, the “breathing” (which happens between translation and the second phase), the second phase (which is the protein movement to the membrane) and finally, the translocation (in this phase the protein attaches to the membrane of bacteria) (Peskin, 1991). With the previous data it was determined E. coli completes these phases in an average time of 5 to 6 min, depending on the protein size (Driessen, 1990). 5min were plugged into the data because NhaS protein is relatively small (69aa).
With the rate of protein transport, Simbiology® was used to model the functional NhaS production. The results are shown in the next diagrams (assuming E. coli is under UV rays which actives its promoter):
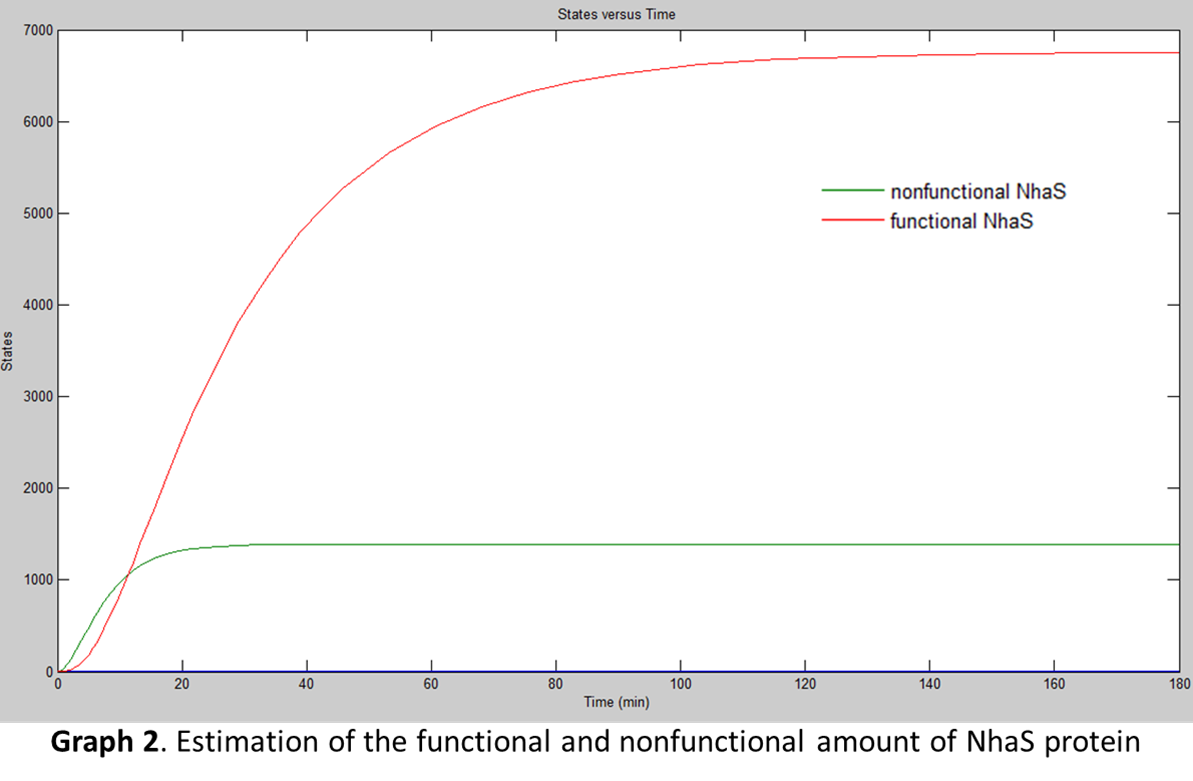
When both graphs were compared (Graph 1 and Graph 2) it was concluded that the amount of functional NhaS is really big. It was assumed that this happened because NhaS is only 69aa in length. Also, it was concluded that NhaS is functional when it is located in the membrane (by functional is meant that it has the potential to capture Na+ ions and be able to give resistance to saline environments) of E. coli. As is shown in Graph 2 the amount is of proteins ready to bind Na+ produced are about 6500.
Bibliography/References
● DRIESSEN, Arnold W. W. (1990). Proton transfer rate-limiting for translocation of precursor proteins by the Escherichia coli translocase. Biochemistry, 2471-2475.
● HARE, James K. T. (1991). Mechanisms of plasma membrane protein degradation: Recycling proteins are degraded more rapidly than those confined to the cell surface. PNAS, 5902-5906.
● LI, Shuang L. X. (2007). A set of UV-inducible autolytic vectors for high throughput screening. Journal of biotechnology, 647-652.
● LONNGO, Diane J. H. (2006). Dynamics of single-cell gene expression. Molecular Systems Biology, 1-10.
● PESKIN, Charles S. S. (1991). What drives the translocation of proteins. Biophysics, 3770-3774.
● SELINGER, Douglas R. M. (2003). Global RNA Half-Life Analysis in Escherichia coli Reveals Positional Patterns of Transcript Degradation. Genome Research, 216-223.
Av. Lázaro Cárdenas to the
East n/a Col. Mederos, Monterrey, Nuevo León, México.
Pedro de Alba n/a Ciudad Universitaria, San Nicolás de Los Garza, Nuevo León, México.

igem.cidebuanl@gmail.com


iGEM CIDEB UANL 2014. CENTRO DE INVESTIGACIÓN Y DESARROLLO DE EDUCACIÓN BILINGÜE. UANL