 "
"
Team:CIDEB-UANL Mexico/math aroma
From 2014hs.igem.org
Oda.ibarra (Talk | contribs) |
Oda.ibarra (Talk | contribs) |
||
| Line 418: | Line 418: | ||
\begin{equation} | \begin{equation} | ||
| - | \large | + | \large f_{post}=\frac{k_{cat}\left [ S \right ]\left [ E \right ]}{K_{m} + \left [ S \right ]} |
\end{equation} | \end{equation} | ||
| Line 426: | Line 426: | ||
\begin{equation} | \begin{equation} | ||
| - | \large | + | \large f_{post}=\frac{k_{cat}\left [ S \right ]\left [ E \right ]}{K_{m} + \left [ S \right ]}=\frac{0.092\left ( 2mM \right )\left [ P \right ]}{23 + 2mM} |
\end{equation} | \end{equation} | ||
Revision as of 02:01, 15 June 2014
|
|


Aroma Module
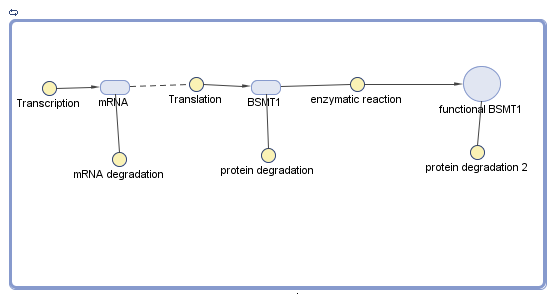
Aroma modules is based in the production of SAM/salicylic acid methyltransferase (BSMT1), to produce methyl salicylate, leaving a physical evidence of wintergreen odor. As this module is not affected by external factors during its transcription, it was used the stablished formula of mRNA and their parameters but with the data we obtained from BSMT1.
\begin{equation} \large \frac{d\left [ mRNA \right ]}{dt}=\alpha_{1}-d_{1}\left [ mRNA \right ] \end{equation}In the case of transalation, a ribo-switch (RNA thermometer) affects the production of the protein BSMT1 (Wintergreen). When the temperature reaches 32°C, ribo-switch allows the transaltion of BSMT1 gene, but at less of it (<32°C), transaltion is not allowed.
\begin{equation} \large \end{equation} \begin{equation} \large \end{equation}We used the parameters for translation and transcription rate from Singapore 2008 iGEM team as well as the speeds at which E. coli carry out transcription and translation assuming a transcription speed of 70nt/s and a translation speed of 40aa/s. So we used them in the equations below with the Wintergreen gene length (1198nt) and protein length (358aa) respectively.
\begin{equation} \large \alpha_{1} = \frac{transcription speed}{gene length \cdot(nt)} \end{equation} \begin{equation} \large \alpha_{2} = \frac{translation speed}{protein length \cdot(aa)} \end{equation} \begin{equation} \large \alpha_{1} = \frac{(70)(60)}{1198} = 3.5 \end{equation} \begin{equation} \large \alpha_{2} = \frac{(40)(60)}{358} = 6.7 \end{equation}Then, we use the parameters for degradation rates for proteins and mRNAs from Beijing PKU 2009 iGEM team:
\begin{equation} \large d_{1} = \frac{1}{half-life} + \frac{1}{30} \cdot(min) \end{equation} \begin{equation} \large d_{2} = \frac{1}{half-life} + \frac{1}{30} \cdot(min) \end{equation}Since BSMT1 (Wintergreen) half-life has not been determined by MIT Team 2006, by the searching of this data, according to Zubieta et al.(2003), the average half-life for salicylic acid methyltransferases are about 40 min.
For determining the degradation rate of average mRNA we used the information from Selinger’s team (2003). They carried several experiments for finding average mRNA half-life in E. coli. They used mRNAs about 1100 nt concluding they have an average half-life of 5min. So with this we found the average mRNA half-life of BSMT1 was 5.44min.
\begin{equation} \large HL = \frac{1100 \cdot(bp)}{5 min} \end{equation}With all these information we could find the degradation rates for both transcription and translation of BSMT1.
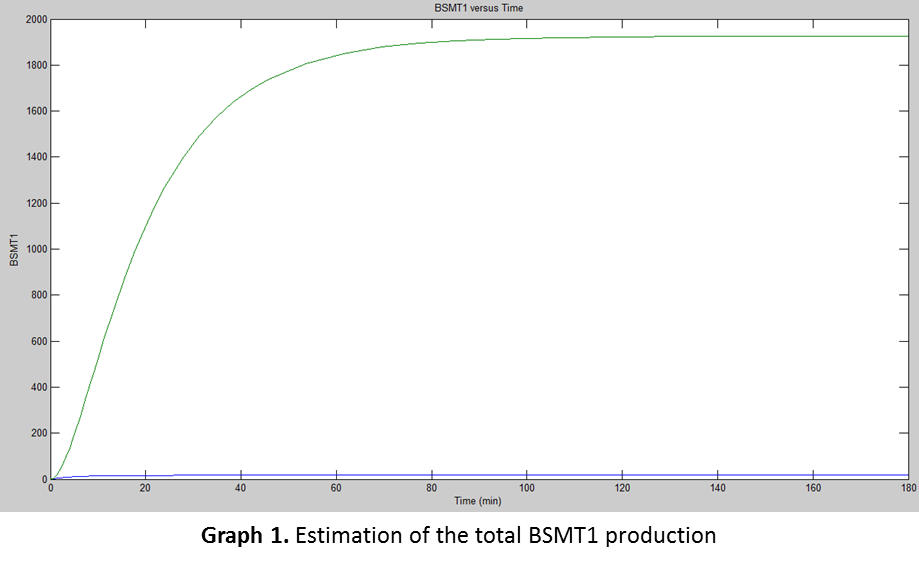
\begin{equation} \large d_{1} = \frac{1}{5.44} + \frac{1}{30} = 0.21 \end{equation} \begin{equation} \large d_{2} = \frac{1}{40} + \frac{1}{30} = 0.058 \end{equation}For the simulation we used Simbiology using the previous data in the equations for finding the amount of proteins E.coli would produce at certain time. The simulation find out the next graph as the result.
But for translation there was another factor we had to consider, the “f(post)” which were the posttranslational variables affecting the production of the functional protein.
\begin{equation} \large \frac{d[P]}{dt} = \alpha_{2} \cdot[mRNA] - d_{2}[P] - f_{post} \end{equation}During the researching of information, we found that BSMT1 is a special type of enzyme called Michaelis-Menten enzyme. As BSMT1 will perform an enzymatic reaction, it is need to know at which rate it will be carried on, to obtain the production of methyl salicylate, responsible of wintergreen odor (Zubieta 2003). For that reason, the posttranslational function taken is considered the rate of methyl salicylate production as the variable that directly affects the production of the final protein concentration. The formula used was also called Michaelis-Menten Equation:
\begin{equation} \large f_{post}=\frac{k_{cat}\left [ S \right ]\left [ E \right ]}{K_{m} + \left [ S \right ]} \end{equation}Where: “[S]” means the substrate concentration; “[E]”, the enzyme concentration (obtained by the rest of the translational formula); “Kcat”; is the turnover number; and “Km”, the substrate concentration needed to achieve a half-maximum enzyme velocity.
Zubieta et al. (2003) established Km and Kcat values for SAM (BSMT1) of 23 and 0.092, respectively. All this values are used when a salicylic acid concentration of 2mM is induced. As [E] stands for enzyme concentration, the protein produced (by the rates of translation and degradation of the protein) will introduce this value in the equation. By substituting these values in the Michaelis-Menten Equation, it will change as follows:
\begin{equation} \large f_{post}=\frac{k_{cat}\left [ S \right ]\left [ E \right ]}{K_{m} + \left [ S \right ]}=\frac{0.092\left ( 2mM \right )\left [ P \right ]}{23 + 2mM} \end{equation}Also, this formula is used in order to get the maximum rate of methyl salicylate production. This value is given by the product of Kcat times the substrate concentration ([S]).
\begin{equation} \large \end{equation}With the association constant we could use it in Simbiology for modelling the functional BSMT1 production. The results are shown next:

With the analysis from both graphs (Graph 1 and Graph 2) we realized the enzymatic reaction was too slow compared with the BSMT1 production leaving almost ¼ nonfunctional of the total amount produced. We assumed that the functional BSMT1 is the final product which releases the Wintergreen odor which would be relatively concentrated according with the amount of proteins produced.
Av. Lázaro Cárdenas to the
East n/a Col. Mederos, Monterrey, Nuevo León, México.
Pedro de Alba n/a Ciudad Universitaria, San Nicolás de Los Garza, Nuevo León, México.

igem.cidebuanl@gmail.com


iGEM CIDEB UANL 2014. CENTRO DE INVESTIGACIÓN Y DESARROLLO DE EDUCACIÓN BILINGÜE. UANL