Team:Shenzhen SZMS/Modelling
From 2014hs.igem.org
Peiwen cai (Talk | contribs) (Created page with "==Modeling== In order to assess the efficiency of our E.coli babysitter, we have made math models for the core system in it, EC 1.7.7.2, which functions as to heat up the environ...") |
Peiwen cai (Talk | contribs) (→Modeling) |
||
| Line 1: | Line 1: | ||
| - | == | + | ==Modelling== |
In order to assess the efficiency of our E.coli babysitter, we have made math models for the core system in it, EC 1.7.7.2, which functions as to heat up the environment to provide a more suitable temperature for the plant. | In order to assess the efficiency of our E.coli babysitter, we have made math models for the core system in it, EC 1.7.7.2, which functions as to heat up the environment to provide a more suitable temperature for the plant. | ||
Revision as of 00:17, 20 June 2014
Modelling
In order to assess the efficiency of our E.coli babysitter, we have made math models for the core system in it, EC 1.7.7.2, which functions as to heat up the environment to provide a more suitable temperature for the plant.
EC 1.7.7.2 is basically a ferredoxin-nitrate reductase; with the required substrates nitrate and reduced ferredoxin, EC 1.7.7.2 is able to catalyze the reactions below:
nitrite + H2O + oxidized ferredoxin ⇄ nitrate + reduced ferredoxin + 2 H+
HNO2 + NH3 = N2↑+ 2H
obviously as suggested above,the first reaction is a reversible one; the heat we need is actually from the second reaction since the first one is basically to convert nitrate provided by our special LB into nitrite.On the other hand, the warmth released by the first reaction is so little that it has nearly no effect on the result. Consequently,we make only the math models for the second reaction, whose substrate is nitrate. As calculated, the general warmth that would be released is 334.55 KJ/mol, which is a theoretical datum.
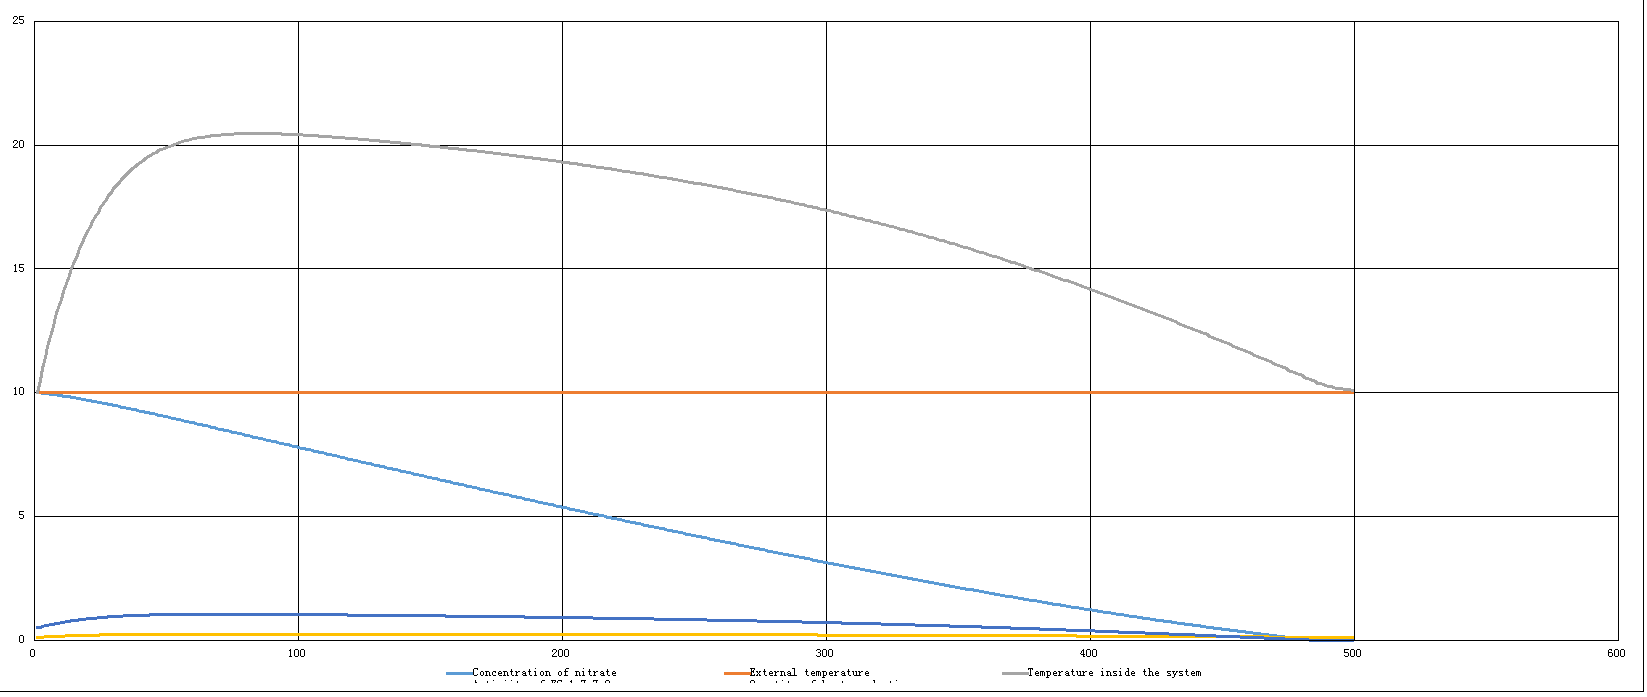
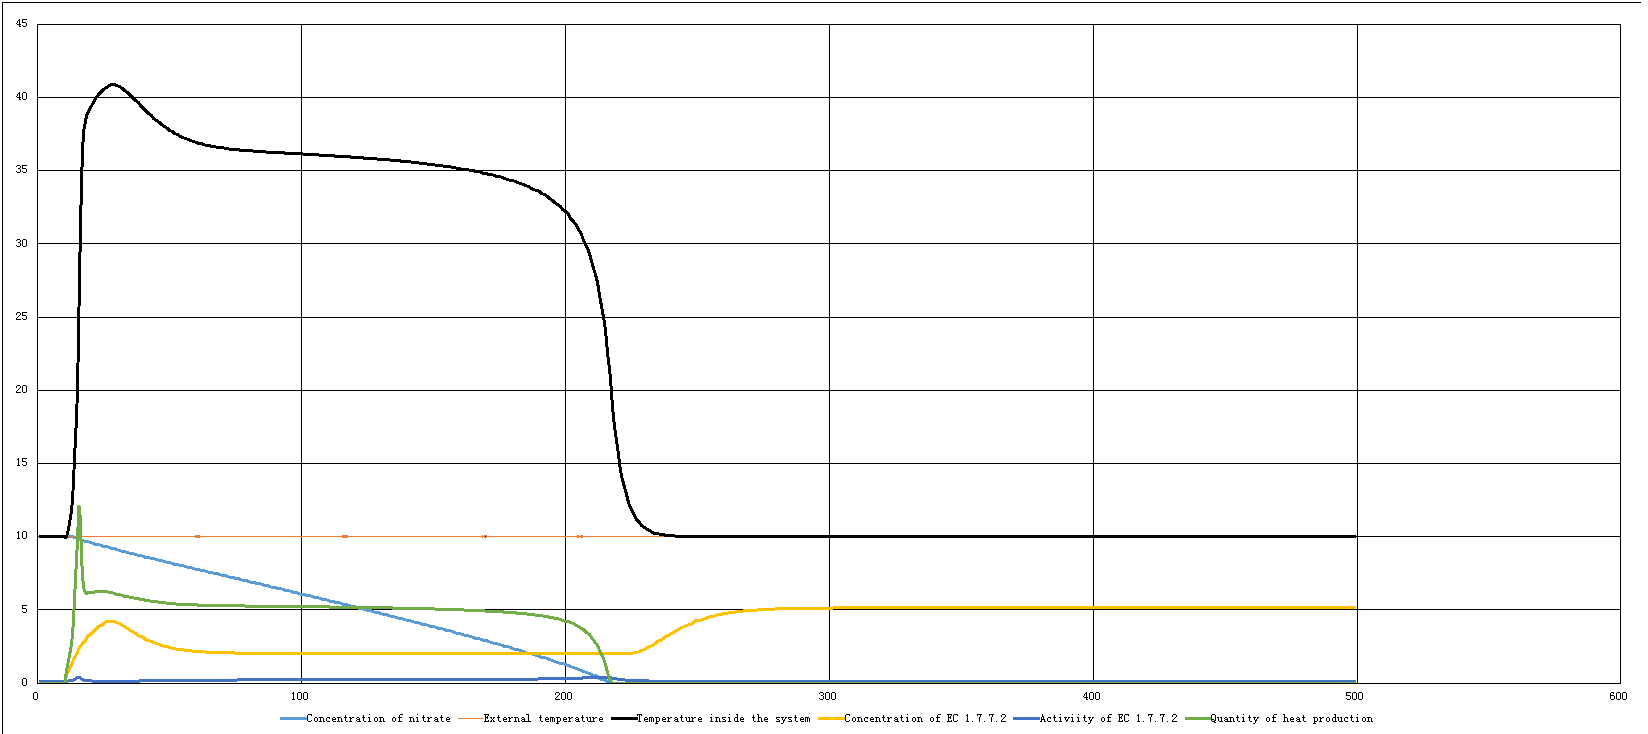
However,considering the fact that we do not have adequate data to carry out our math models, we finally decide to use proportionality instead of accurate data. Both of the following charts are established by Excel.
The first one is a model under the condition that purely only EC 1.7.7.2 is functioning, which means, the concentration of it remains unchanged: (grey bold line → temperature inside the systerm)
The second one is a model under the condition that RNA Thermometer in the first part of our entire plasmid is functioning to start the heating-up system which is mostly EC 1.7.7.2 in certain extent of external temperature (<27℃). Since it is being manipulated by the other system, the concentration of EC 1.7.7.2 can no long remain unchanged, but changed over time: (black bold line → temperature inside the systerm)
General information about EC 1.7.7.2 can be found in the following link: http://www.genome.jp/dbget-bin/www_bget?ec:1.7.7.2.
 "
"

